For a successful e-commerce business (any business, really), you need to know your goals and measure your results. There’s no single way to do this, but there are a number of essential e-commerce metrics that can be used universally.
Even though performance tracking in e-commerce is a commonly discussed topic, surveys reveal that 30% of brands can’t find meaningful metrics, and over 70% don’t measure their return on investment. Don’t let your business exist in a vacuum where there are no specific objectives or they are not properly monitored—define what parameters are valuable to you.
In this post, we’ll guide you through the 10 key metrics for e-commerce. Check how many of them you already track and think of how you can improve the process of setting and analyzing KPIs and metrics.
Before we dive in, let’s straighten out the differences between e-commerce KPIs and metrics:
- Metrics are quantitative performance parameters that can measure anything related to your store: the number of visitors, the level of cart abandonment, engagement on social media, the rate of returning customers, etc. The list of e-commerce metrics is practically endless, and each one can be further divided: for example, you can measure the overall conversion rate and the rate of many different micro- and macro-conversions.
- KPIs (key performance indicators) are those parameters that define the growth of your business and are crucial for you. All KPIs are metrics (but not metrics are KPIs), and it’s up to you to choose what to choose from the plenitude of metrics to set as your KPIs.
Are you only thinking about launching a store? Try Shopify for free.

10 top e-commerce metrics
We’re going to cover different metrics, why they are needed, how to calculate them, and how often to track them. When you understand the landscape of what you can measure for your store, you should define what to focus on as your e-commerce KPIs.
There’s no point in monitoring everything you can: it’s easy to get lost in an overabundance of parameters. Dedicate your time and effort only to those metrics you find useful at any given stage of your store’s development.
1. Sales conversion rate
Sales conversion rate = number of orders / number of visitors
Your conversion rate indicates how many store visitors have actually bought something. You can also measure micro-conversions like the add-to-cart rate, loyalty program sign-ups, etc.—just replace the number of checkouts with the relevant activity in the formula. Or, you track e-commerce conversion metrics by channel (website traffic, PPC, email), campaign, or product category. But first and foremost, you need to track how many people end up placing orders.
According to the report by Unbounce, the average conversion rate was 5.2% in 2021. Note that this number varies depending on the e-commerce niche.

❗ Learn how to improve your results from our guide to e-commerce conversion rate optimization.
2. Average order value (AOV)
Average order value = total revenue / number of orders
Just like with most e-commerce metrics, there’s no universal answer to what a good and bad AOV is. It largely depends on your products: their price range, how regularly people might need them, etc.
Regardless of product types, tracking AOV will help you:
- Measure your profitability. Cross-referenced with the average customer acquisition cost (CAC), AOV will show you if your marketing and sales efforts have paid off. For a sustainable business, your AOV should be significantly and consistently higher than CAC.
- Understand your store’s growth. When you have AOV data for different time periods, you can see the dynamics. You can have expected spikes or declines in AOV (for example, during the seasonal sale and after it), but if you notice that your AOV decreased for no obvious reason, it’s a signal for you to investigate, find the problems and fix them. Similarly, if you have a great positive change in this metric and you don’t know what actions contributed to that, it makes sense to analyze what has happened so that you can solidify great results.
- Predict future revenue. In combination with other e-commerce metrics like traffic and conversion rate, you can see what revenue you can expect and plan your budgets accordingly.
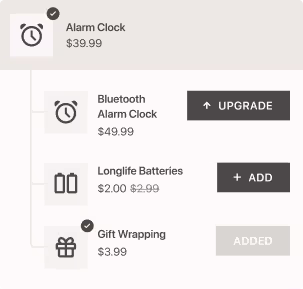
❗ To boost your AOV, you can implement upselling and cross-selling techniques, bundle products, and offer free gifts with purchase. Informing customers about free shipping conditions is also a great motivator for them to spend more.

3. Customer lifetime value (CLTV)
Customer lifetime value = order value x number of orders in a given time x customer lifespan
You can measure each individual lifetime value, as well as the average one. It makes sense to use customer segmentation and analyze the value of each distinguished group. This will help you effectively allocate the resources based on what customer segments bring you more profits.
Information about customers with the highest lifetime value gives you:
- Possibility to improve engagement with them. You can personalize your communication and design exclusive deals targeted at high-value customers.
- Chances to acquire new profitable customers. If you notice some purchasing patterns particular to high-value customers—for example, they are steadily interested in a particular product category or usually request some product customization—you can use these insights in marketing and advertising campaigns.
❗ Speaking of customer segmentation, RFM analysis is a sure way to divide your audience by the value they represent for your business. If your store runs on Shopify, try out the Loyal app that will give you digestible information about 6 distinctive customer groups.
4. Customer acquisition cost (CAC)
Customer acquisition cost = marketing expenses / number of orders by new customers
This metric can also be called cost per acquisition (CPA). You can measure it overall or based on each particular channel.
To understand if your acquisition costs are low enough, look at your CLTV and AOV measurements. Acquisition costs are justified only when you get more in revenue. How much more you need to maintain a stable operation depends on various factors like price margins or inventory costs.
5. Cart abandonment
Cart abandonment rate = 1 - number of completed checkouts / number of carts created
The way businesses deal with cart abandonment is pivotal to their success. It’s absolutely normal to get a high cart abandonment rate—its average measurement is around 70%. What matters is if you manage to improve it.
Regularly tracking this metric will help you:
- Understand potential revenue loss. If you multiply the cart abandonment rate by your average order value, you can visualize how much money slipped through your fingers.
- Investigate the major conversion blockers that happen at different stages of the purchase funnel. Knowing how many visitors abandon their carts and how this parameter changes over time, you can analyze what prevents people from buying and what changes you implement impact their motivation. In this context, heatmap tools can help you see users’ movements and actions to understand when exactly they drop off.
❗ One of the biggest reasons behind cart abandonment is the overcomplicated checkout process. Learn how to improve it from our guide to checkout optimization.

6. Refund rate
Refund rate = number of refunds / total number of orders
Dealing with returns and refunds is an inevitable part of an e-commerce business. In fact, the average return rate has grown by 6% from 2020 to 2021, reaching 16.6%.
When products are returned, you’re not just losing revenue from that purchase but also spending more on logistics and storage. Plus, if those products are perishable or seasonal, you might end up with dead stock that is a major drag on your budget.
With that said, you should monitor how often customers request refunds and whether this indicator grows, and you have to think of how to minimize it.
❗ Realistic product images might decrease the refund rate. Videos are proven to be even more effective: consider incorporating video content, linking your store to YouTube, and cooperating with influencers for leveraging social commerce.
7. Retention
Retention rate = (number of customers at the end of a given period - number of newly acquired customers) / number of customers at the beginning of a given period
You can also go with simpler calculations and just measure the number of returning customers—they are the major indicators of retention. This metric is especially important for stores that sell products with a high purchase frequency: food, hygiene items, etc.
Retention is much easier to improve than acquisition, and even a slight increase by 5% can lead to 25-95% higher profits. With that in mind, you should work on encouraging customers to return and make more purchases.
❗ The tips we’ve mentioned for boosting conversions and AOV are also good for improving retention. Social proof indicators and loyalty programs can also be quite helpful.
8. Click-through rate
Click-through rate = number of clicks / number of views
This parameter is tracked for each individual channel and campaign. You can analyze how many people click on your PPC ads on Google and social media, how many users visit your website from emails, and so on.
The average CTR is pretty low: around 1.6% for search ads and 2% for emails, for example. Still, it makes sense to measure it and try to improve it.
CTR is important for analyzing your marketing and SEO success. When you experiment with different approaches to campaigns and compare this parameter, you can see what works best in attracting users’ attention.
For instance, you can learn your organic CTR from Google Search Console and adjust your SEO strategy by optimizing pages that get a lot of impressions but not enough clicks.

9. Stock-to-sales ratio
Stock-to-sales ratio = stock value / net sales value
Inventory management has its own bunch of metrics you can use, with the stock-to-sales ratio being one of the primary things to track.
The closer this metric is to zero, the better. It’s crucial to control it to ensure you order and store as much inventory as you need, which means that you don’t overspend on inventory that is not selling and don’t end up with unexpected stockouts.
The stock-to-sales ratio can help you understand your capital allocation in inventory. If you use it together with the turnover rate (that shows how often you sell and restock certain products) and snapshots of daily, weekly, and monthly inventory (the quantity of each item you have), you can see when you need to improve inventory levels and when you should modify your replenishment plan.
10. Net promoter score
Net promoter score = percentage of promoters (customers who gave a 9-10 rating) - percentage of detractors (customers who gave a rating of 6 and lower)
This metric is the one you need to collect proactively. It’s measured by customer responses to the survey that asks them to rate your store and their shopping experience on a scale of 0 to 10. You can display this survey as a pop-up on the order confirmation page, use it in your shopping app, or send it in emails.
Based on the score customers give you, they are divided into Promoters (9-10), Passives (7-8), and Detractors (6 and less). Naturally, your goal is to have as many promoters as possible and make additional steps with customers that are not much satisfied to learn about their needs and the issues they’ve had with your store.
Some e-commerce brands prefer NPS alternatives, for instance, the Emotional Value Index (EVI), which measures customer experience by emotional reactions.

How often to track e-commerce metrics?
KPIs are usually measured monthly, quarterly, and yearly. The smaller time period might not give you enough data to compare and gain insights into how you’re moving toward your business objectives.
However, some of the metrics can be tracked as frequently as daily. For example, site visits, the number of orders, or inventory sold. If you’re currently running an ad campaign, it also makes sense to measure its results on a daily basis. The same applies if you’re active on social media—you track the level of engagement every day.
Then, you can check some parameters weekly or bi-weekly: cart abandonments, AOV, CAC, and anything else that matters for you in this timeframe. For monthly checkups, focus on those e-commerce metrics that show a larger picture: retention, churn (for subscription-based products), and the parameters mentioned as weekly as well. All these can also be included in your yearly reports, but you might want to concentrate on the metrics related to your revenue: sales conversion rate, revenue per visitor, inventory turnover, etc.
How to set e-commerce KPIs?
When you define the KPIs for your e-commerce business, follow the SMART framework to ensure that chosen metrics are:
- Specific. For example, if you want to measure conversions, determine which ones exactly (completed orders only or something else as well).
- Measurable. All your KPIs should be quantifiable and objective.
- Attainable. The results you’re aiming for should be possible to achieve.
- Relevant. Think of what matters to your particular business. For instance, if you focus your marketing efforts on emails, you can have several email-related KPIs like opt-ins and click-through rates.
- Time-bound. Decide on a frequency of KPI checking and set deadlines for achieving your e-commerce benchmarks.
Another helpful framework is the AARRR one, which suggests you group your KPIs based on five stages:
- Acquisition. It’s important to evaluate how many people you attract.
- Activation. This aspect shows the steps people take that might convert them into customers (for example, how many people sign up for a newsletter or add items to wishlists).
- Revenue. Here, you measure everything related to order metrics.
- Retention. You need to understand how many customers are willing to return and what can impact this.
- Referral. At this stage, you’re analyzing how many customers become your most loyal ones that recommend your store to others. The NPS and its alternatives come into play here.
In any case, set KPIs that can be applied to your business and your specific goals.