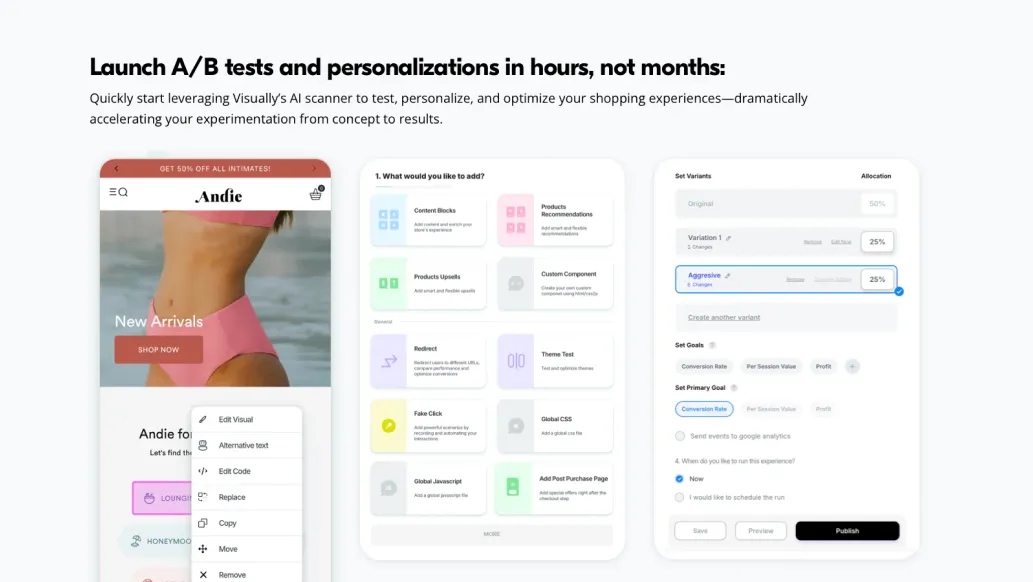
If you want to run proper experiments without handing everything to a developer, Visually is one of the easier ways to start. The visual editor sits on top of your theme, so changing copy, buttons, sections, or adding badges and banners feels quick and safe. Targeting is solid (page, device, traffic source, customer attributes/markets) and you can combine it with built-in upsell/recommendation widgets to test full flows, not just single elements.
The reporting focuses on the metrics you actually care about: revenue, AOV, units, and you can layer COGS (cost of goods) to judge lifts on profit, not just conversion rate. That’s useful when an upsell or discount changes margins.
For checkout changes and price testing, the app leans on Shopify’s Checkout Extensibility and store permissions, so Plus merchants get the most out of it. Non-Plus stores still get a lot of value from PDP/collection/cart experiments and from on-site personalization.
Pricing model and plans
Visually’s pricing scales by monthly orders. There’s a 14-day free trial and a free plan for development stores. Entry tiers cover low order volumes and already include the visual editor, personalization, unlimited A/B tests, and upsells/recommendations. As your orders grow, you move into higher tiers that unlock advanced levers, such as price tests and shipping rate/threshold experiments. Because billing tracks order volume, costs may adjust in busy months; keep that in mind for seasonality.
Rating
As of November 2025, the app sits around 4.8/5 from ~90 reviews on the Shopify App Store. Merchants consistently praise the intuitive editor and fast, hands-on support. Critiques typically mention that some high-impact features are gated to Plus or higher plans, and that interpreting Bayesian results has a short learning curve if you’ve only used “classic” frequentist dashboards.